


As originally published by our Marketing Thought Leader, Daniel McCarthy & Peter Fader on HBR.com.
In the weeks leading up to the initial public offering of apparel retailer Revolve Group, in June 2019, investors struggled to come up with a fair valuation. Several recent IPOs—most notably those of the ride-hailing firms Uber and Lyft—had been disappointing. Revolve had delayed its IPO for months because of a downturn in the stock market. Despite the headwinds, its IPO was priced at $1.2 billion—and it exploded by an additional 89% on its first day of trading, making it one of the best first-day IPO performances of 2019. The spike brought the company’s valuation to roughly 4.5 times its revenue over the previous 12 months—five times the multiple of its apparel-retailing peers and more akin to that of a technology company. What happened, and why did investors originally fail to see just how strong a firm Revolve was?
Revolve’s premium valuation was not a fluke. It stemmed from the firm’s strong underlying fundamentals, which were not fully appreciated by the underwriters who set the IPO price. This strength was less about top-line revenue growth and more about strong customer-unit economics: Simply put, Revolve not only acquired its customers profitably but retained them for many years, and that meant its longer-term profit potential was larger than its revenue growth to date had implied.
Revolve’s IPO success illustrates the movement toward customer-driven investment methodologies. Using customer metrics to assess a firm’s underlying value, a process our research has popularized, is called customer-based corporate valuation (CBCV). This approach is driving a meaningful shift away from the common but dangerous mindset of “growth at all costs” toward revenue durability and unit economics—and bringing a much higher degree of precision, accountability, and diagnostic value to the new loyalty economy.
In this article, we explain how executives and investors can use the principles of CBCV to better understand and measure the value of a firm. The methodology works whether the company features a predictable, subscription-driven revenue stream (think of Netflix and Verizon) or a base of active customers who place discretionary orders every so often (think of Uber and Walmart). We also discuss how companies can benefit from providing investors with more of the right kinds of customer data—and how investors can avoid being fooled by vanity metrics that appear to be useful indicators of customer behavior but aren’t as meaningful as they might think.
A More Precise Way to Forecast Revenue
The premise behind CBCV is simple. Most traditional financial-valuation methods require quarterly financial projections, most notably of revenue. Recognizing that every dollar of revenue comes from a customer who makes a purchase, CBCV exploits basic accounting principles to make revenue projections from the bottom up instead of from the top down. Although this may seem like a radical departure from traditional frameworks, that’s not the case: CBCV simply brings more focus to how individual customer behavior drives the top line.
What do we need to implement CBCV? In addition to the usual financial statement data, two things are required: a model for customer behavior (what we call the customer-base model), and customer data that we feed into it. The model consists of four interlocking submodels governing how each customer of a firm will behave. They are:
- the customer acquisition model, which forecasts the inflow of new customers
- the customer retention model, which forecasts how long customers will remain active
- the purchase model, which forecasts how frequently customers will transact with a firm
- the basket-size model, which forecasts how much customers spend per purchase
Bringing these models together enables us to understand the critical behaviors of every customer at a firm—who will be acquired when, how much they’ll spend over time, and so on. Summing up all the projected spends across customers gives us our quarterly revenue forecasts. Together, these models can produce much more precise estimates of future revenues streams—and from that, one can make much better estimates of what a company is really worth.
This basic model is universal, no matter what kind of business a company is in. Exactly how it is specified, however, depends on the company’s business model—in particular, on whether the company is subscription-based or not. At a subscription-based business, such as a gym or a telecommunications firm, managers generally know how much customers will spend each month, and they are able to directly observe when customers churn out, because they literally cancel their contracts and close their accounts. This simplifies how the retention and purchasing submodels are built.
Most companies, however, are characterized by discretionary (that is, nonsubscription) purchasing and unobservable customer churn. If you have an Amazon account but decide never to buy from the company again, for example, it’s difficult for anyone inside or outside Amazon to immediately recognize that. Marketers call this latent attrition. Accounting for it requires more-complicated submodels, but marketers have developed methods for predicting it extremely well.
Peeking Inside the Black Box
Although this methodology may seem daunting, it’s relatively simple to get going, and it can be refined and extended as appropriate for particular business contexts.
Let’s peek inside the black box through an example. Imagine that you’re the founder of a young, fast-growing, subscription-based meal-kit company. In its first four months of operation, your company generated $1,000, $2,500, $4,500, and $7,000 in total revenues respectively. You would like to understand what this means for future revenues and the overall viability of your business. As a start, you want to forecast revenue in month five.
Let’s suppose that active customers pay a flat fee of $100 per month for meal kits delivered over the course of the month, and that the company acquired 10, 20, 30, and 40 customers, respectively, in its first four months of operation (100 in total). Half the acquired customers churned out in their first month; all customers who did not churn out in the first month have remained.
The first step in forecasting month five revenue is to figure out how much revenue will come from retained customers. Of the 100 customers acquired over the first four months, half, or 50, will still be with the company in month five if historical retention trends persist. Thus, the portion of month five revenue from retained customers is $5,000 (50 x $100). The next step is to forecast how much revenue will come from new customers. Assuming that acquisition trends continue, you can expect an additional 50 customers, representing $5,000 of revenue. By adding up the two forecasts, you arrive at a total monthly revenue of $10,000.
Using the CBCV approach, revenue numbers no longer exist in a vacuum. Instead, they are a direct function of a small set of behavioral drivers—in this example, total customers acquired, retention dynamics, and average revenue per user (ARPU). This framework makes revenue forecasting easier and serves as a diagnostic, helping managers and investors understand where the value creation is coming from (and what questions to ask when results are out of line with expectations).
Of course, few companies will have such simple models and neat patterns as our meal-kit example. Our purpose here is to outline the general mechanics of the approach, as extensions of it follow naturally. Suppose, for example, that your firm has tiered pricing (it also offers a second plan that delivers twice as many meals a month for $189). In that case, you would need to account for variable ARPU from period to period. If the firm allows customers to skip deliveries or make discretionary purchases, you would need to track order frequency and average spend per order. If the firm pivots to sell meals à la carte instead of on a subscription basis, you’ll need to use a model that predicts how often customers will place orders. These extensions add complexity to the model, but the basic process to incorporate them would be the same as in the example above. If you want to extend the time horizon beyond month five, you can repeat the calculation for multiple months. That gives you a long-term revenue forecast, which is vital for corporate valuation.
For an in-depth discussion of the CBCV methodology in complex scenarios, see our academic papers “Valuing Subscription-Based Businesses Using Publicly Disclosed Customer Data” (Journal of Marketing, October 2016) and “Customer-Based Corporate Valuation for Publicly Traded Non-Contractual Firms” (Journal of Marketing Research, March 2018).
Looking at Customers from Inside and Outside
The richness of the insights that can be derived from CBCV depend on how much access the person performing the analysis has to internal company data. A corporate executive would have full visibility of all customer data. A private equity investor assessing an acquisition target would typically have access to transactional and CRM data. For subscription firms, that would include the length of contracts, periodic payments, and observable churn; for nonsubscription firms, it would include the timing and size of each individual purchase. Access to other behavioral data, demographics, marketing touchpoints, service interactions, and the like would further enrich the CBCV analysis.
For those on the outside looking in—hedge funds, Wall Street analysts, regulators, and others—detailed customer data might be impossible to obtain on a regular basis. They may, however, have access to the firm’s customer cohort chart, or C3, which tracks revenue by acquisition cohort over time and shows how total customer spending changes as each cohort ages. (For an example, see the exhibit “C3: A New Tool for Corporate Valuation.”) Many large, reputable firms (both subscription and nonsubscription) have begun to disclose their C3, among them Slack Technologies, Dropbox, Lyft, and luxury marketplaces the RealReal and Farfetch. A firm’s C3, along with the number of active customers and the total number of orders, is sufficient to give investors a good understanding of customer behavior.
C3: A New Tool for Corporate Valuation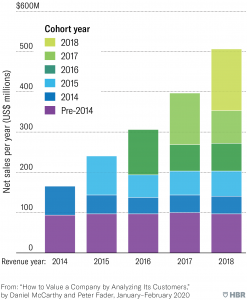
The customer cohort chart is straightfoward: total revenue, period by period, broken down by customer acquisition cohort. Though its format may vary, the C3 is increasingly finding its way into companies’ public filings, giving investors a powerful tool for gauging what a company is really worth. This example of a C3 comes from Revolve Clothing’s 2019 SEC filing.
If a firm can’t or won’t release its C3, investors should press it to reveal four key metrics: the number of active customers (in total and the percentage from tenured customers, or customers who have been with the firm for over 12 months); gross acquired customers over the most recent period; revenue (total and percentage from tenured customers); and the number of orders (total and percentage from tenured customers).
While we would strongly encourage firms to disclose more, having three or four years’ worth of these disclosures (from past filings) is enough to run a CBCV model and assess the overall health of a company’s customer base, albeit with greater uncertainty about future revenues.
Trending Toward Transparency
Few companies currently provide all the data outsiders need to perform CBCV, for a variety of reasons. First, disclosure of customer metrics is voluntary, and companies feel little to no pressure to make them available. Second, there is little consensus about which customer metrics are the most informative and how those metrics should be calculated and reported. And finally, policy makers and regulators have been largely silent about these issues, leaving disclosure to companies’ discretion.
Unfortunately, executives often have a “less is more” mentality regarding disclosure. They fear that additional disclosure, however aggregated the numbers may be, could put them at a competitive disadvantage or open them up to potential litigation or regulatory scrutiny. Successful firms worry about how investors will react if the metrics they’re disclosing start going in the wrong direction. And customer-level forecasting often remains siloed in the marketing department; managers in finance and related functions are unaccustomed to incorporating customer behaviors in their revenue forecasts and are more comfortable using traditional methods.
In the absence of investor pressure and regulatory standards, firms can arbitrarily choose which metrics to disclose, generally selecting those that paint an overly rosy picture for the investment community. The metrics are often defined improperly, based on faulty assumptions, or framed incorrectly.
Think about the story your customer metrics would tell if disclosure were required.
Consider Peloton, which sells high-end home-exercise equipment and monthly subscriptions to streaming-video fitness classes. When it filed its pre-IPO S-1, in August 2019, it chose to disclose its customer lifetime value (CLV) per subscriber, boasting a CLV of $3,593 in its most recent fiscal year. To its credit, Peloton also disclosed the underlying formula it used to compute its CLV, but that formula left much to be desired. The most glaring problem was that it did not account for the time value of money, and instead simply added more than 13 years’ worth of future cash flows without discounting them. Applying even a modest discount rate would slash its CLV by more than 50%—a drop with significant implications for the health of the customer base. As more firms voluntarily disclose customer metrics, analysts must be vigilant about vetting data that may be misleading or is mostly window dressing.
Although Peloton’s metrics are far from perfect, they nevertheless represent an encouraging shift toward transparency around customers that will be good for shareholders, companies, and customers. Shareholders will increasingly rely on customer data to evaluate potential investments as more purchases are made online and traditional brick-and-mortar metrics, such as same-store sales, decline in relevance. Executives can use customer data to build the case for investing in activities that will generate long-term value for the firm and to communicate to shareholders the impact of those investments on CLV and other long-term metrics. Customers will be treated as strategic assets whose value should be cultivated over the long term. This mindset will be a welcome change from the status quo, in which shareholders, lacking the information needed to assess long-term customer profitability, compensate by pushing firms to hit short-term performance measures.
Until the CBCV revolution fully takes hold, what does all this mean for you? If you are an investor, don’t ignore the customer-related metrics that may be tucked away in financial reports; actively seek them out. If the data you need isn’t disclosed, demand it, or find alternative sources that can serve as effective proxies. Focusing on unit economics will almost certainly reveal opportunities you can exploit.
If you’re an executive and you aren’t currently disclosing your customer metrics, start thinking about the story they would tell if disclosure were required. If you would not be proud of your metrics as they stand, this is your golden opportunity to refocus on and improve the health of your customer base in the dark. It may not be long before market participants demand sunlight.


